Public transport model in the province of Pavia
Pavia

MIC-HUB analysed mobile and traffic data to scientifically define a new transport model of the area, a tool that will support the client in its future mobility decisions.
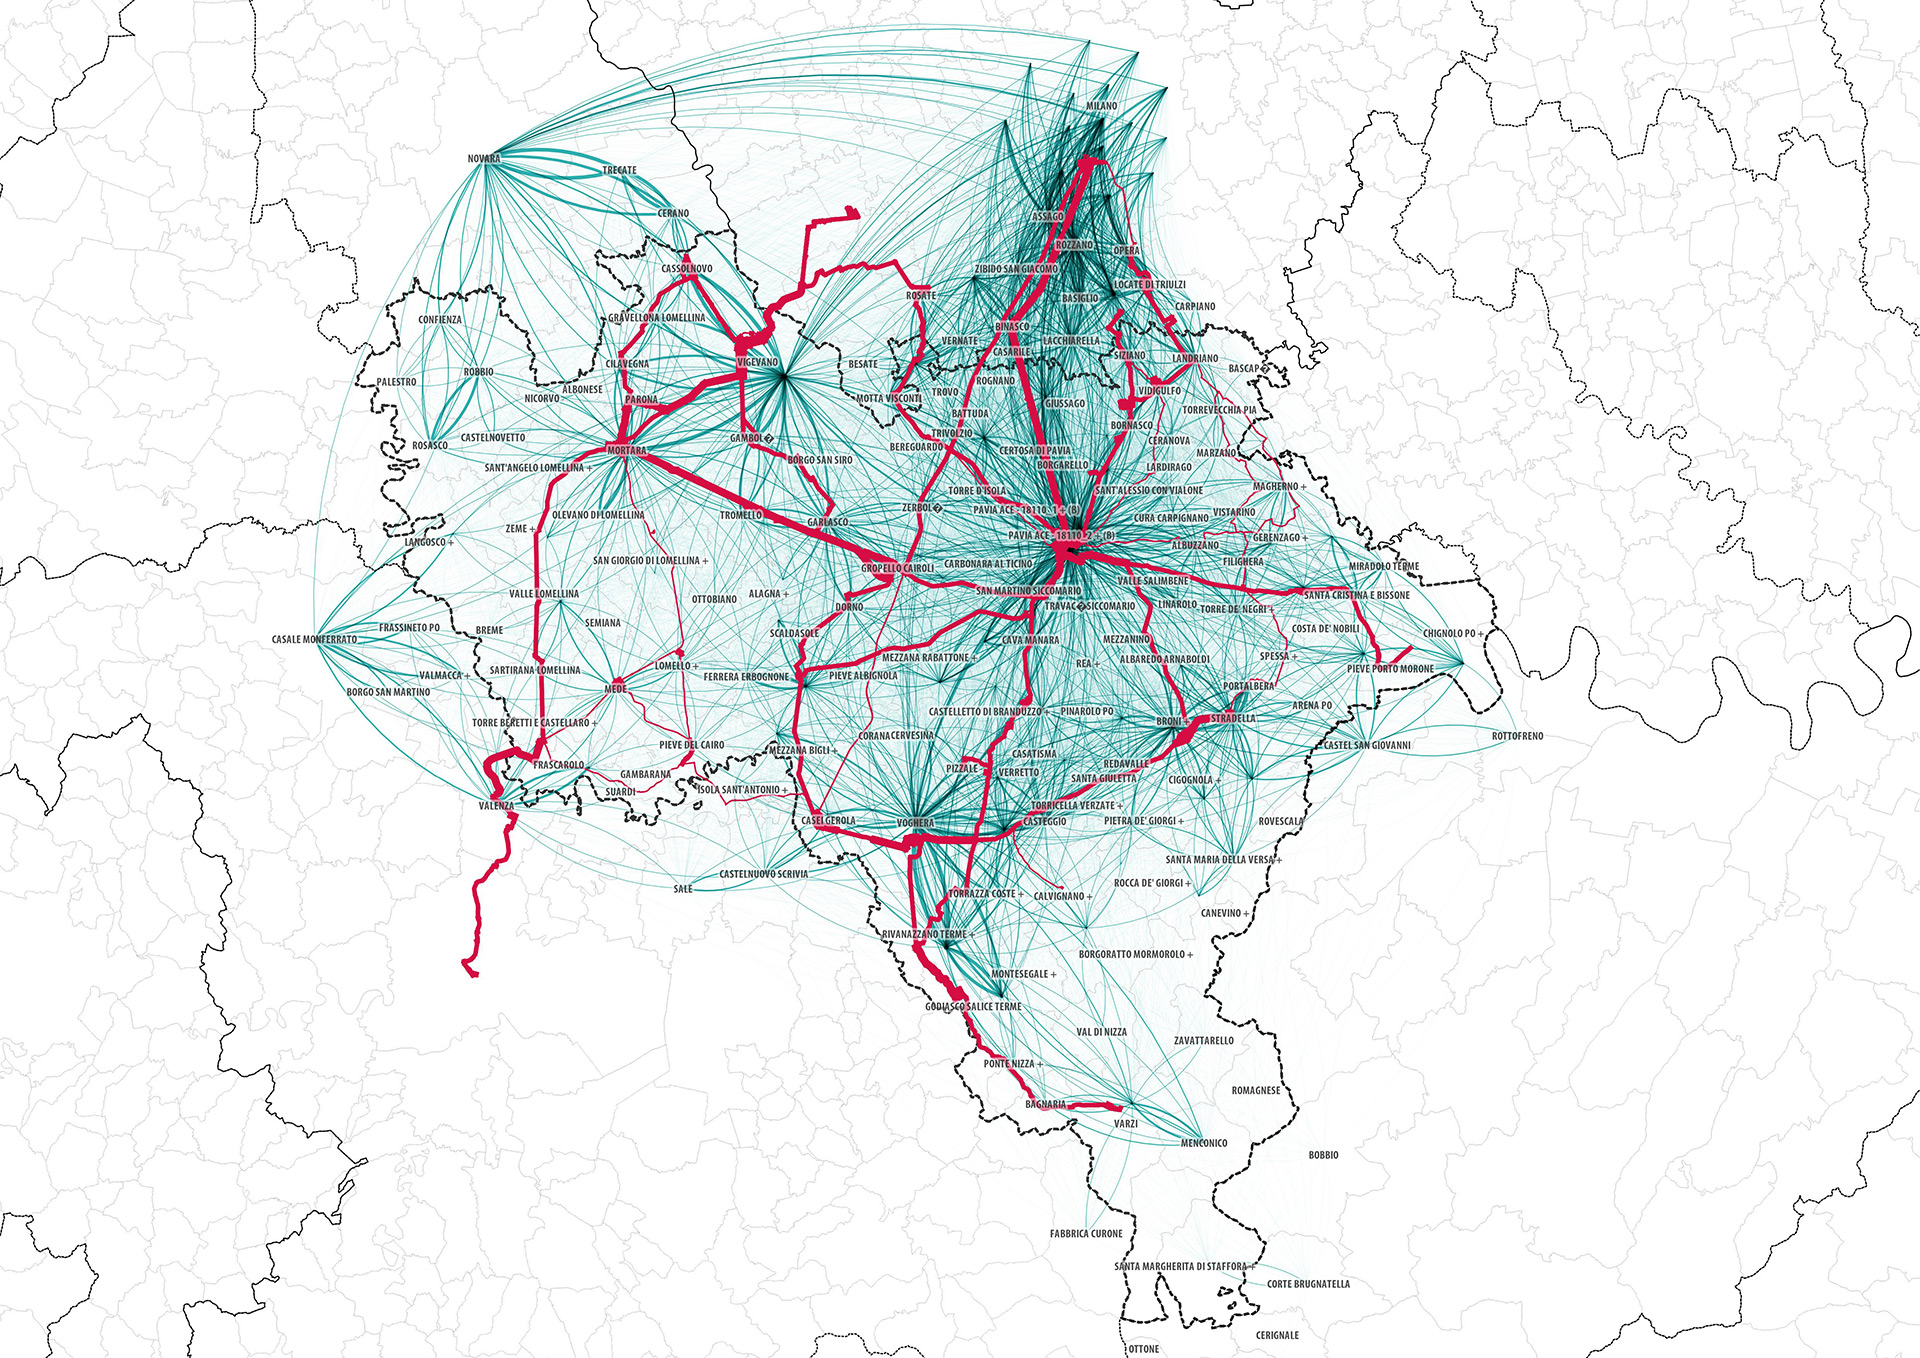
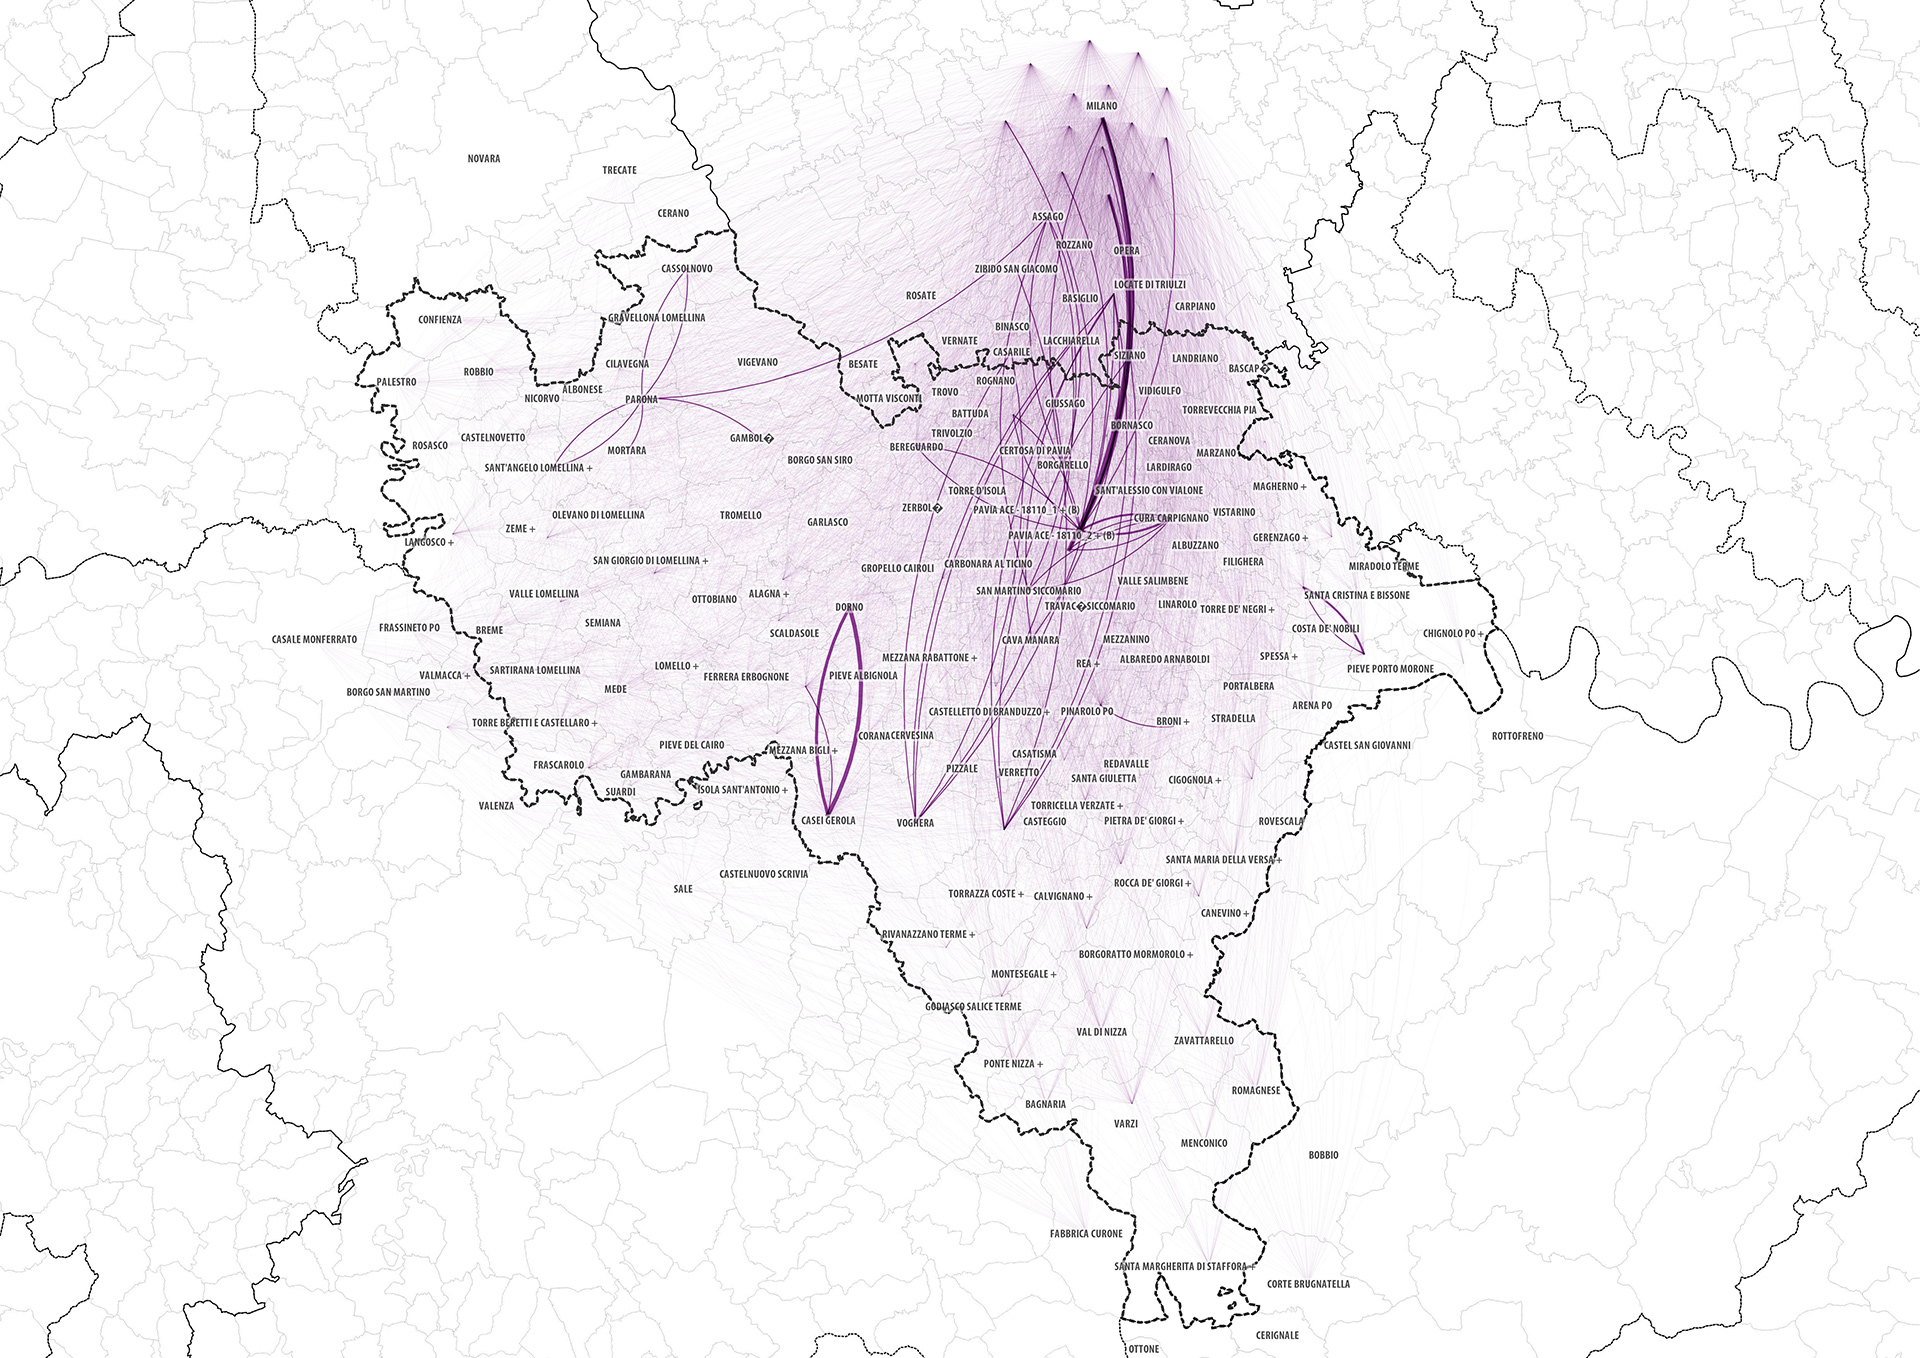
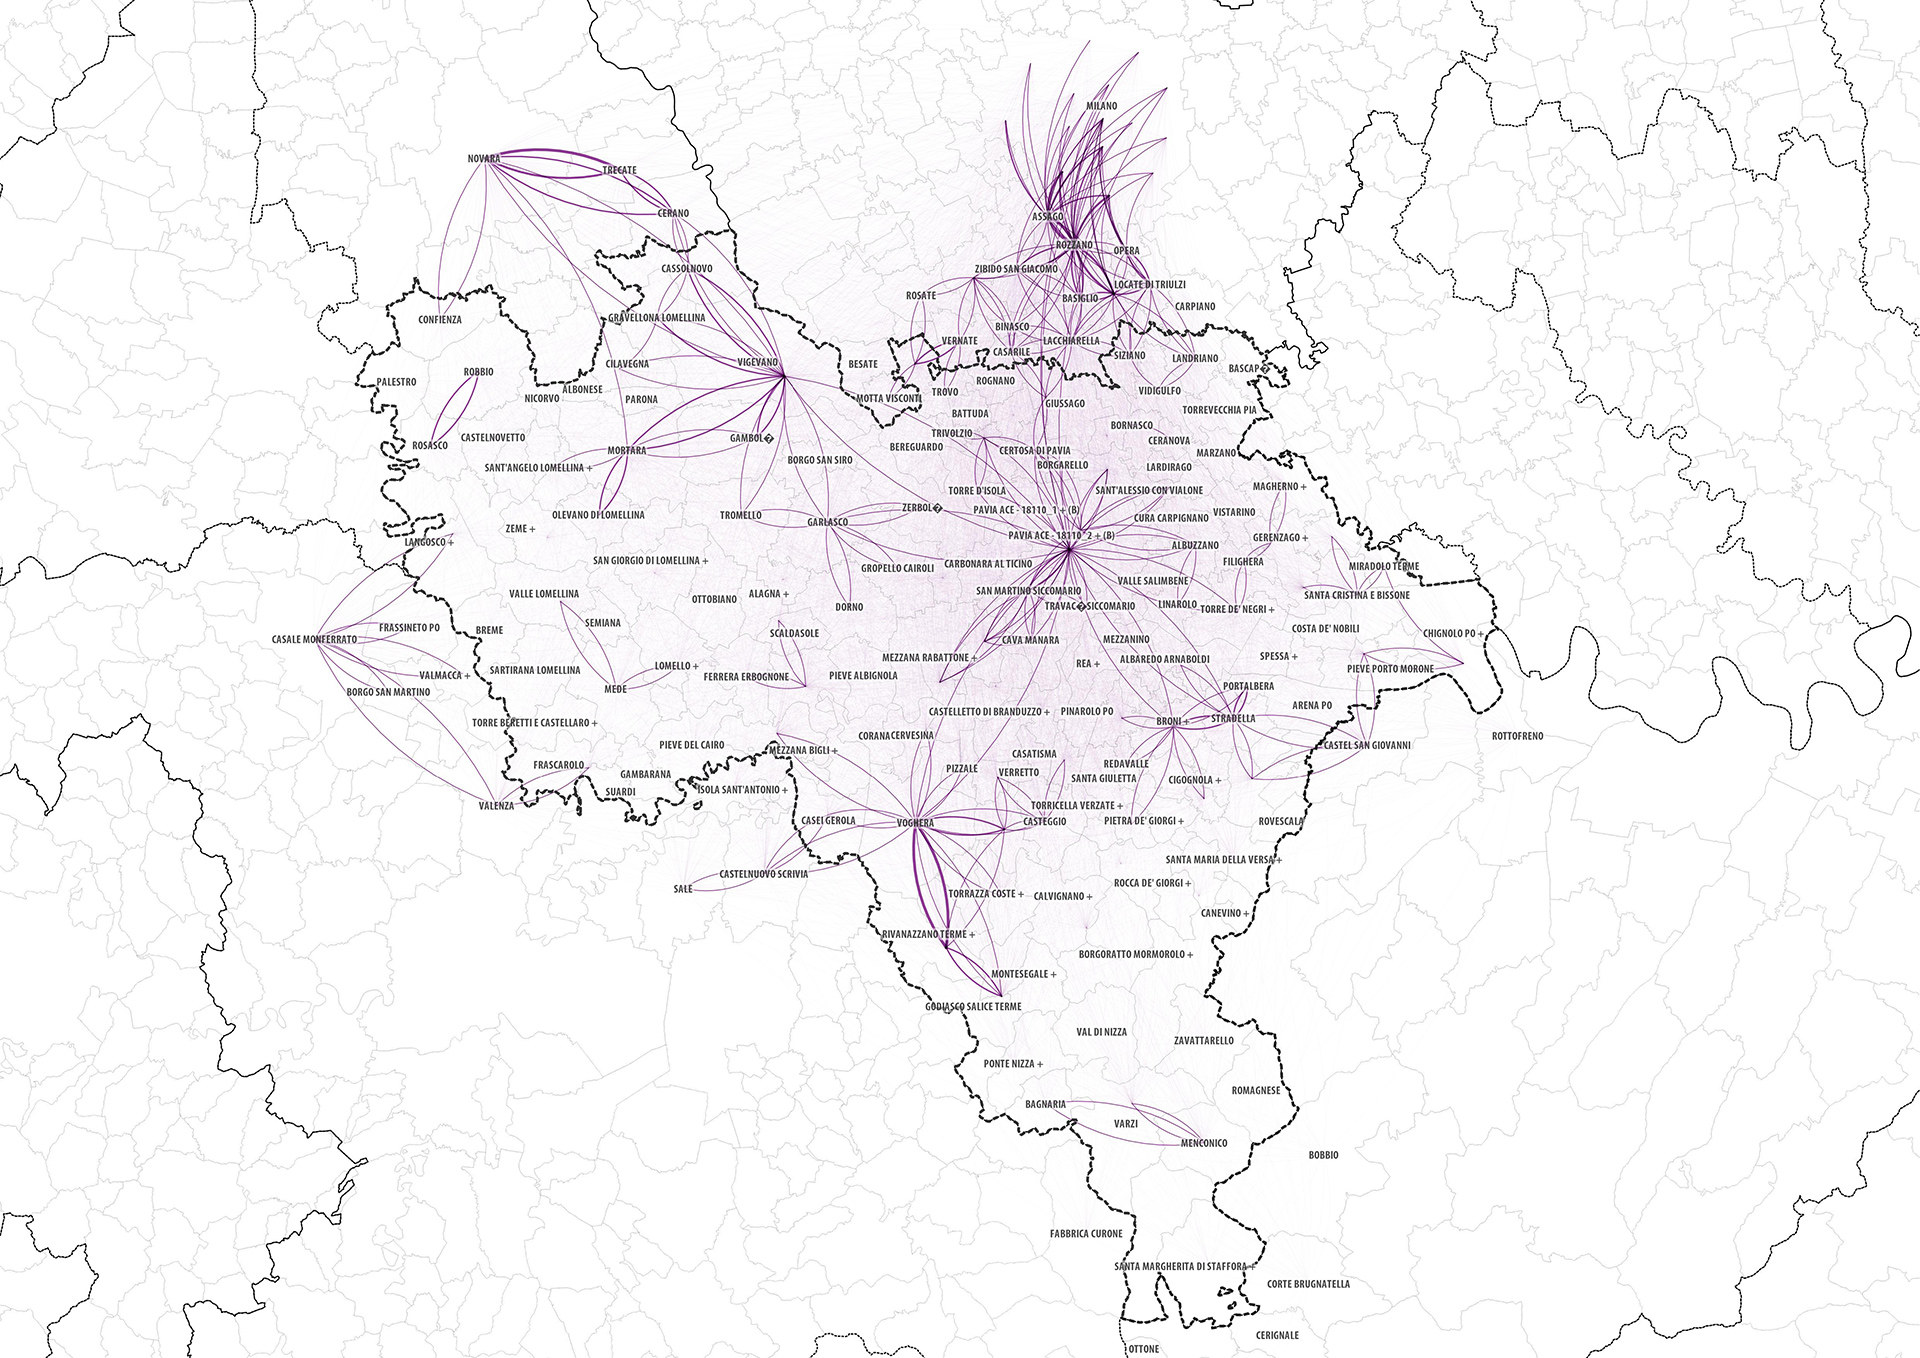
GIS-based analyses and elaborations of mobile data were produced, including an O/D matrix to study the travel habits within the area, using aggregated and anonymous data from Vodafone.
The collected data was used to define a strategy based on user mobility patterns, in order to develop project proposals for network expansion and service optimisation, and to create a mobility database for the regional area.
Studies and travel data were used to test different scenarios and reconfigure the public transport offer in the area.
Location
Pavia
Client
Public transport model in the province of Pavia
PROJECT HIGHLIGHTS
- Creation of a database to support customers in the decision-making process
- GIS-based analyses and elaborations of mobile data
- Definition of three possible network alternatives
Project gallery

Our contribution
MIC-HUB supported the client in developing a transport-based analytical methodology to ensure a consistent, inclusive and versatile demand-related system.
The methodology aimed to:
• interpret the characteristics of the territory and its mobility needs;
• support the definition of a new network scheme to respond to the emerging demand picture;
• test this scheme and provide performance parameters to assess the real impact of service changes;
• be implemented with limited recourse to data collection activities, using data from digital technologies (Vodafone Analytics, Floating Car Data, etc.);
• be implemented with limited recourse to operator intervention.
Thanks to this methodology, MIC-HUB was able to identify the backbone network, compare the data with that from current and planned systems, and verify the supply/demand ratio. This approach enabled objective criteria to be established on which to base proposals and rationalise future public transport services.
MIC-HUB produced three different network scenarios, following an incremental process whereby the number of kilometres offered and the amount of demand intercepted increase with each network 'jump'.